Connect to the Natural World
View the Project on GitHub mganucheau/Connect-to-the-Natural-World
A guide to plugging plants into the web using Arduino, Processing and Google Docs.
I've always been frustrated with the technical and time requirements needed to view physical sensor data on the web. Services like Xively, ThingSpeak and Nimbits all provide excellent features, but they also require enough prerequisite knowledge of specific web technologies to appear intimidating, especially to those new to programming. While searching for an easier method to employ in youth programs, I came across some wonderful examples on journal.code4lib.org and Instructables on how to use Google Docs as an simplified the process significantly.
This tutorial is designed to give a brief overview of facilitating multiple software and hardware components. With that said, this process can be streamlined even further with devices such as an Arduino Wifi Shield, Raspberry Pi or an Electric Imp, to name just a few.
Hardware used in this tutorial:
Software used in this tutorial:
-
Arduino
-
Humidity Temperature Sensor - Arduino Library (How to install)
-
Processing
-
HTTProcessing - Processing Library (How to Install)
1. Arduino
- Setup your sensors by assembling the breadboard as shown below. In this setup we are only using the breadboard to send power and ground across the side rails. Connect the signal of your humidity & temperature sensor to the Arduino's Digital Input Pin 2 and the signal of your moisture sensor to the Arduino's Analog Input Pin 0

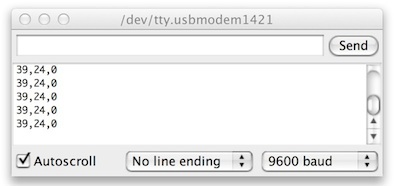
- Open and run PlantSensors.ino. Now open your Serial Window and you should see your 3 variables streaming.
| Sensor | Range |
|---|---|
| Humidity | 20% - 90% (RH) |
| Temperature | 0 - 50 (C) |
| Moisture | 0 - 950 |
2. Google Forms
- Create a Google Form with 3 text inputs labeled:
Humidity, Temperature and Moisture

- While Viewing the Form, copy the form url key located here and save it for later, you will need it:

- Next, save the entry id that is generated for each field by control clicking on the field and selecting Inspect Element (note: this method may vary depending on your browser). Here you can find the entry ID as the string of numbers following #entry_ .

3. Processing
- Open and run SensorsTest.pde. Then check for the streaming variables to make sure that the data you are receiving from the Arduino is correct. Depending on your setup, you may need to change the serial port that is being called by changing the variable on line 22 (in this case it is port 1). To help you find your appropriate port, all of your serial ports are printed on launch.

- Next, open Sensors2gDocs.pde and, in the setup of your sketch, replace the XXXXXXXXXX in lines 8 - 11, with the information you recorded earlier from your google form. Now run the script and open your google form.
4. Visualize it
- If all is working correctly you should see the information being updated. Next stop the Arduino so we can work on this spreadsheet without it conflicting. On the side of your spreadsheet, use the following formulas to find the last entry in each column and label these accordingly.
=INDEX( A:A ; ROWS( A:A ) )
=INDEX( B:B ; ROWS( B:B ) )
=INDEX( C:C ; ROWS( C:C ) )
=INDEX( D:D ; ROWS( D:D ) )

- With the variables for Humidity, Temperature and Moisture selected Insert a Gauge Chart.

- After you have a gauge chart created, toggle the menu option in the upper right and select Publish Chart. This will then give you the code needed to embed your gauges in another webpage.

Note: The downside to viewing the gauge with this method is that the gauge chart will only update when the page is reloaded. To have the gauge automatically refresh we will need to use some javascript to define how we populate the gauge. Stay tuned for that tutorial to come!